Views
ShotAnalyzer offers 4 different views for detailed analysis and evaluation:
![]() Target view
Target view
![]() Shooter view
Shooter view
![]() Group images
Group images
![]() Distribution of the hold area
Distribution of the hold area
Target view
The target view provides the following information:
- Bottom left: Display of the current hit in decimal scores and the values P2H1 (hold area 1sec before the shot) and P3H1 (follow-through area 0.3-1sec after the shot).
- Bottom right: The turning help shows how many clicks are necessary and in which direction the knobs on the rear sight have to be turned in order for the next hit to be closer to the center. In the Display tab of the configuration menu, you can set whether the calculation is made per shot or on the basis of the whole group.
- Aiming-process line (light green): Shows how the shooter approaches the center. This line is divided in time intervals distinguishable through the different coloring.
- Light green: Aiming process
- Dark green: Lowest point 4 sec before the shot is fired => line of the lowest point
- Yellow: 1 sec before the shot => hold area (P2H1) (P2H1)
- Blue: 200 ms before the shot => small hold area (P2H2) (P2H2)
- Red: Aiming after the shot
- Brown: 0.3 to 1 sec after the shot => follow-through area (P3H1)
- Median approach line (Hellblau): (light blue): Median line calculated from all values obtained between entering the 4-point zone and reaching the 8-point zone.
- Line of the lowest point (purple): Lowest point before the shot is fired. This point is calculated for a specified time range. (Default: 4 sec before the shot)
- At the top on the left: Replaying the recording aiming process

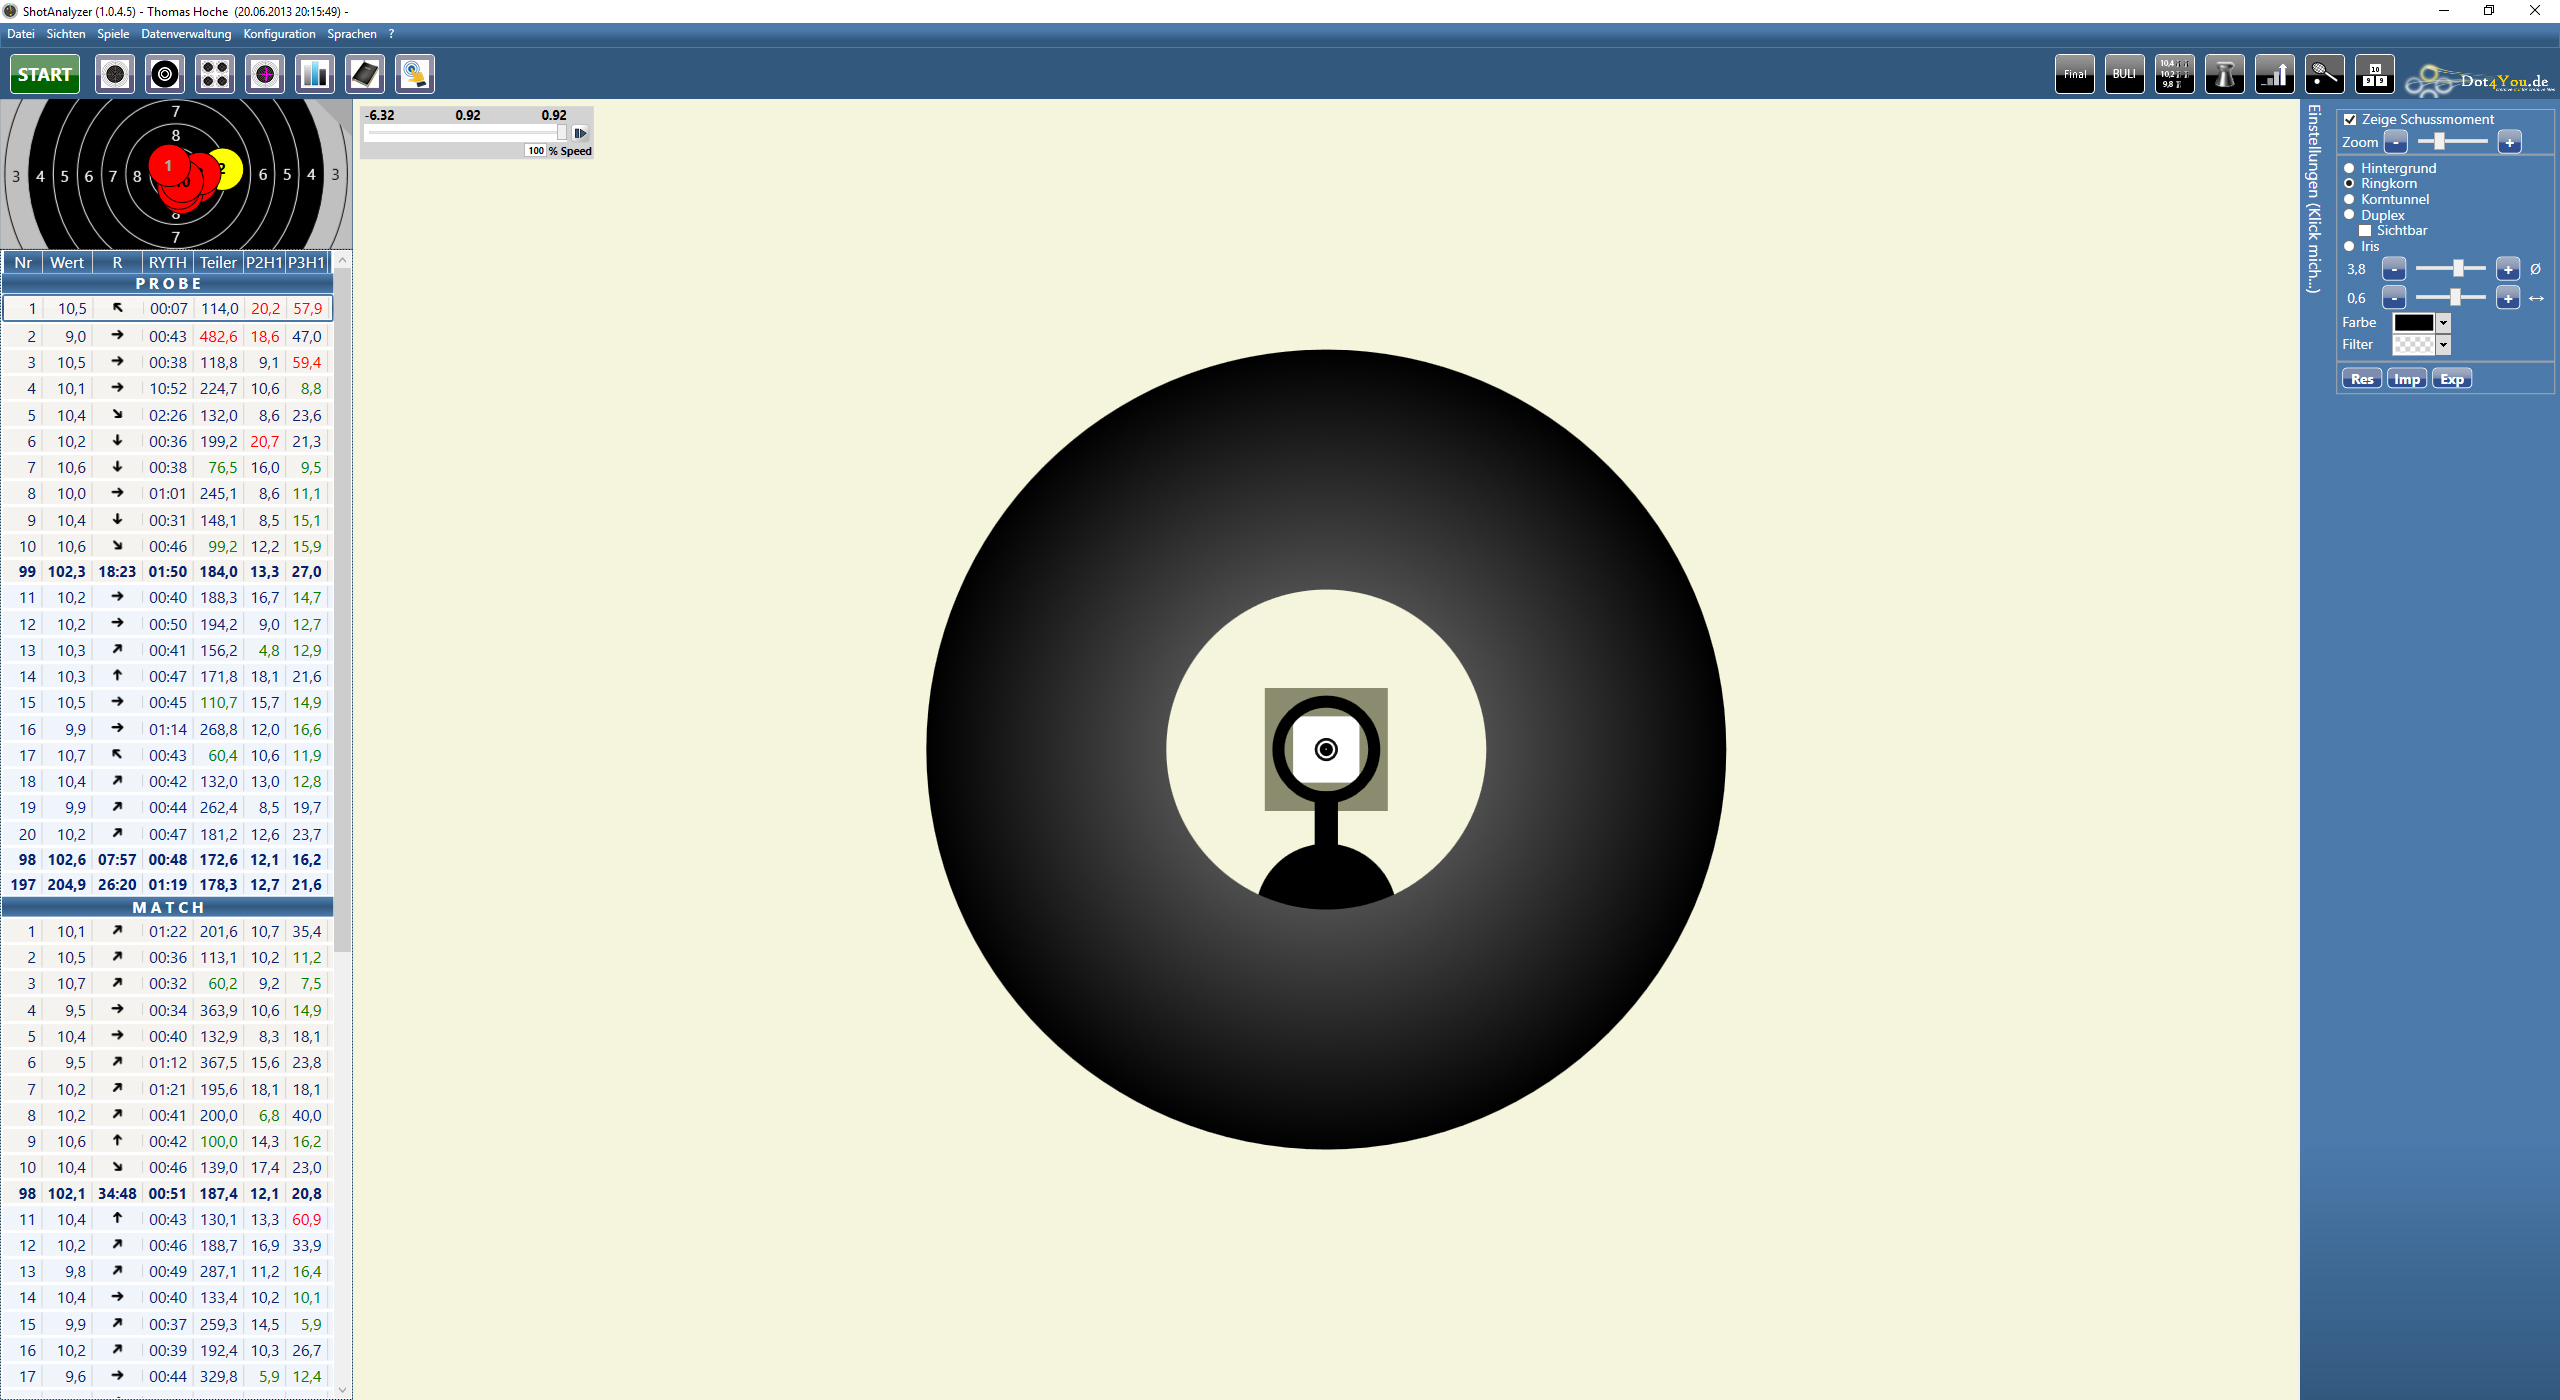
Shooter vies
This tool gives the shooter and the coach feedback on how the shooter perceives the aiming process. Each component, e.g. size and width of the front-sight ring, color filter or background color, can be set separately. The aiming process can then be played with the settings made in the shooter view.
- Show moment of the shot: During the replay of the process, the shot is shown on the target at the moment of firing.
- Zoom: Zooms in on the display
- Front-sight ring: Diameter, width, color of the ring
- Front-sight tube: Diameter, width and color
- Duplex: Diameter, width, color of the ring and the filter
- Iris: Diameter, width, color of the iris and the filter
- Background: Background color, color of the frame and the target
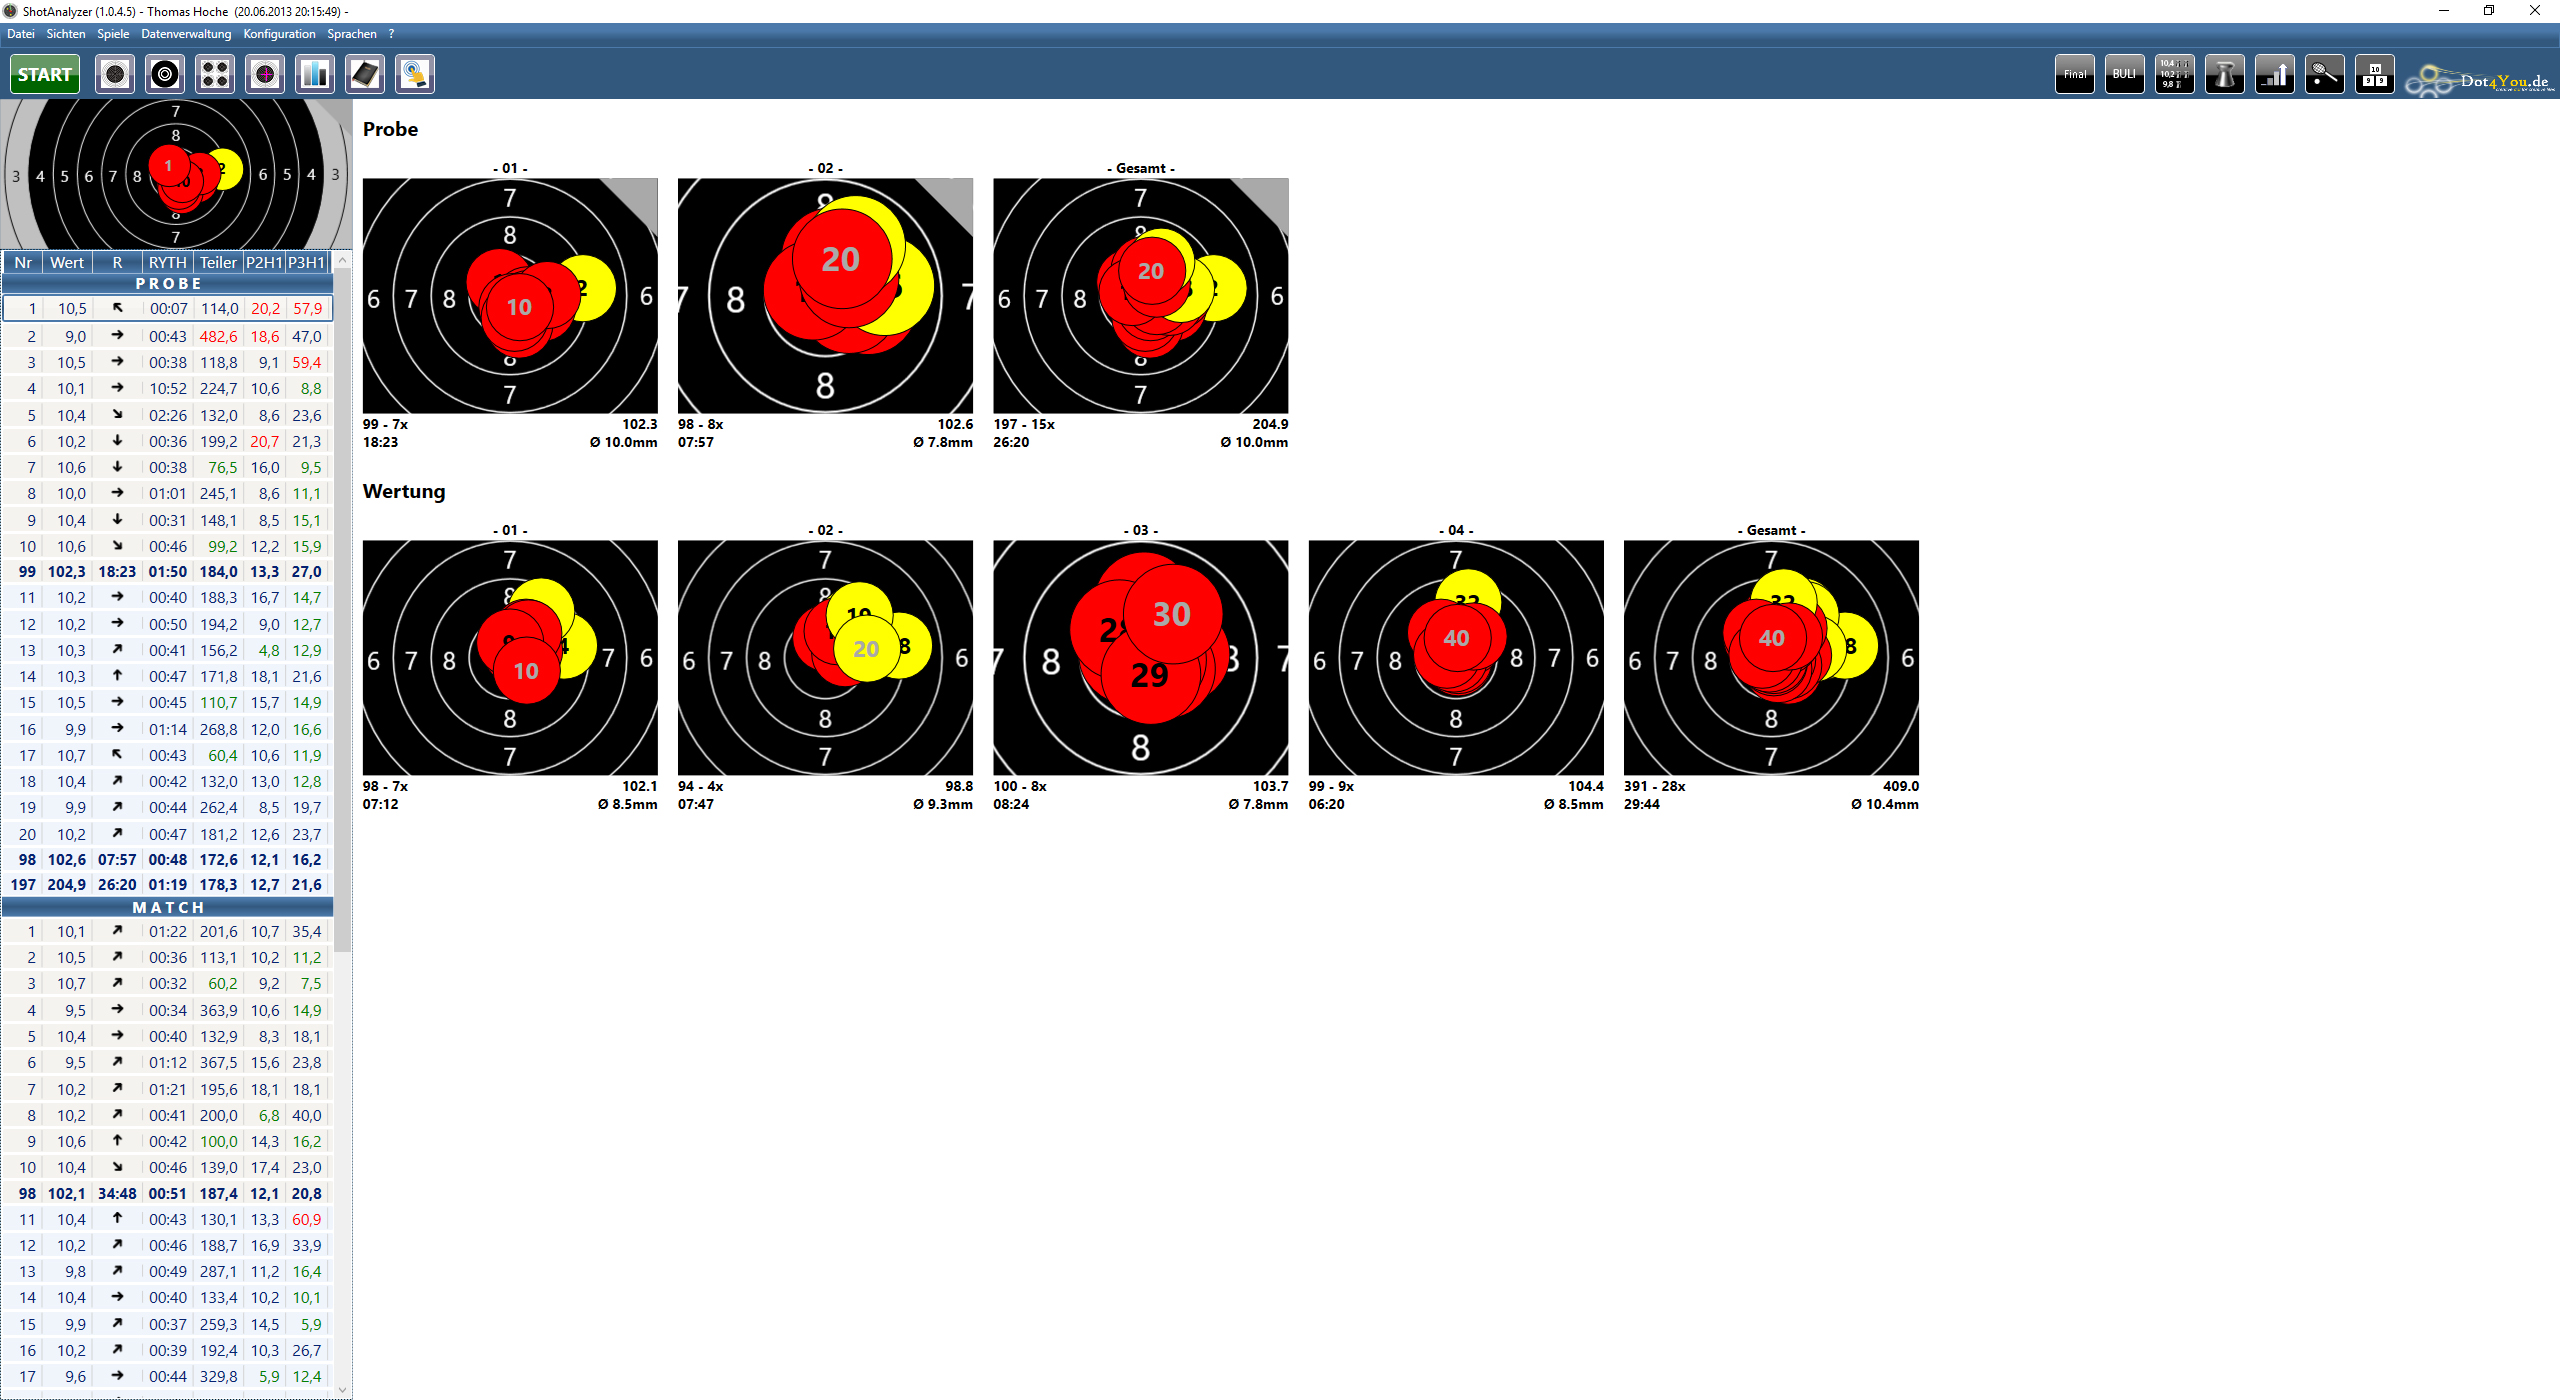
Group images
In this view, you can look at complete 10 series as group images. It always starts with the practice shots. The practice mode can be identified by the grey triangle in the top right corner of the target. The number of each series is found above the target. At the end, the overall group of all hits is displayed.
Distribution of the hold area
The distribution of the hold area should visualize the “systematic aiming error” made by the shooter. For this visualization, the midpoint of the area P2H1 (hold area 1s before the shot is fired) is projected onto the target (yellow dots). Additionally, the overall midpoint is calculated from all midpoints (yellow cross). It is easily recognizable where the shooter is aiming most often. Additionally, the position (red cross) of either the current hit or of the whole group is shown. The shooter can therefore see how big the distance is between the hits (yellow cross and red cross).