Analysis and evaluation
ShotAnalyzer offers the user extensive analysis possibilities in four areas:
- 1. Phase: Approach (entering the target until entering the 8-point zone)
- 2. Phase: Aiming
- 3. Phase: Follow-through
- General values
1. Phase: Approach
In this phase, the following values can be analyzed more closely:
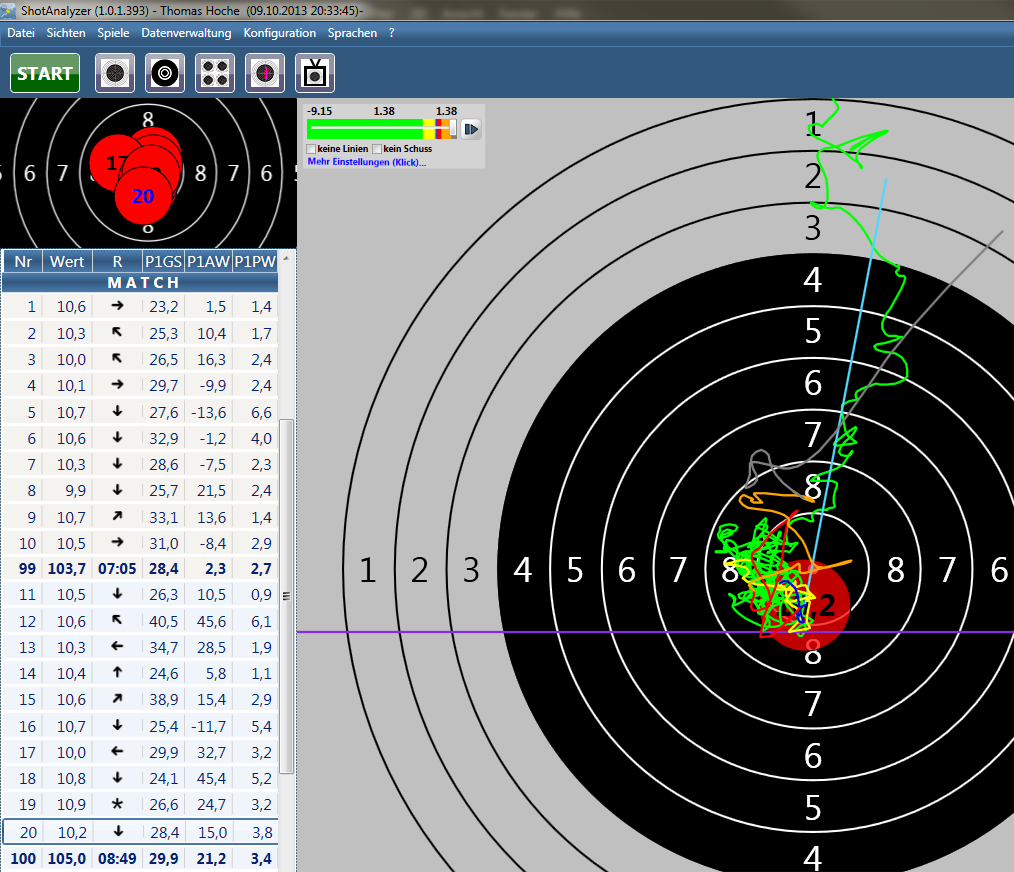
- Speed – display in ShotAnalyzer: P1GS
This speed designates the mean speed with which the target is entered, measured in mm/s. The software calculates the mean speed from the point of entering the target to reaching the 8-point zone. The measured speed should be as steady as possible. - Approach angle – display in ShotAnalyzer: P1AW
The approach angle is defined as the mean angle measured from the point at which the target is entered to the center of the target.
Good shots usually approach the center from above. ShotAnalyzer sets the angle when the target is approached directly from above to 0°. Deviations to the right are displayed with “+” values and deviations to left with “-” values. When the target is approached from the bottom, the software displays 180°.
The differences between the approach angles should be as small and steady as possible since the target should always be approached from the same direction. - Pendulum value – display in ShotAnalyzer: P1PW
The pendulum value designates the mean distance between several measuring points and the approach line. The pendulum value is indicated in mm and should be as small as possible. This should ensure that the shooter approaches the target with as few variability as possible.
2. Phase: Aiming
In this phase, the following values can be analyzed more closely:
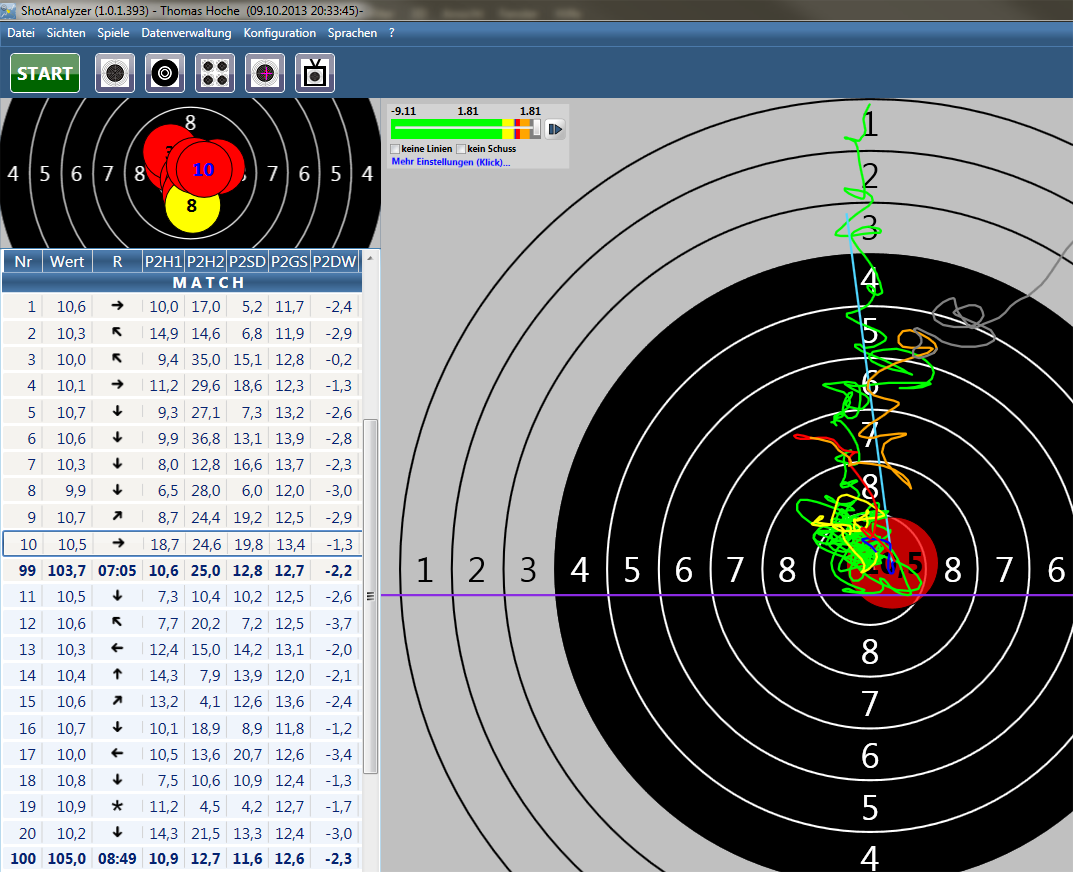
- Hold speed stability – display in ShotAnalyzer: P2GS
Hold speed designates the speed of muzzle movements during aiming. The muzzle movements are measured. The slower the speed, the slower the movements in the last seconds before the shot is fired and the higher and more stable the hit values. In ShotAnalyzer, the hold speed designates the mean speed from the point the 8-point zone is entered until the shot is fired. It is indicated in mm/s. The hold speed should be as small and steady as possible. - Hold area
The hold area designates the area to which a resting muzzle points directly before the shot. A good shot should be able to keep the muzzle in the 10 in the last second until the shot is fired. The shot is thus fired from a “safe” area.
The following values can be analyzed in ShotAnalyzer. They should be as small as possible. They are indicated in square millimeters mm2:- Hold area 1s before the shot – display in ShotAnalyzer: P2H1
- Hold area 200ms before the shot – display in ShotAnalyzer: P2H2
- Distance between the hit and the center of the hold area – display in ShotAnalyzer: P2SD
In ShotAnalyzer, this value designates the distance between the midpoint of the hit and the hold area 1s before the shot. It is indicated in mm. The lower the value, the “cleaner” the shot has been fired and the trigger has not been jerked. Ideally, the hold area 1s before the shot is hit. - Lowest point – display in ShotAnalyzer: P2PW
The lowest point is the lowest point measured in a time period of 4 seconds before the shot is fired. It should be as close as possible to the target’s horizontal line. Read more here → Line of the lowest point
3. Phase: Follow-through
In this phase, the following values can be analyzed more closely:
- Follow-through area in the range of 0.3s to 1s after the shot – display in ShotAnalyzer: P3H1
The process of following-through is important for an optimal shot since it prevents the pellet from being influenced by sudden and premature movements If the shooter interrupts the process, the shot can be disturbed fractions of seconds before it actually breaks.
Why is there a delay of 0.3 seconds until the shot is calculated? When the shot is released, the muzzle of the rifle jumps slightly. This jump should not be taken into account for the calculations. - Distance between the hit and the center of the follow-through area – display in ShotAnalyzer: P3SD
In ShotAnalyzer, this value designates the distance between the midpoint of the hit and the midpoint of the follow-through area 0.3s to 1s after the shot. It is indicated in mm. The lower the value, the “cleaner” the shot has been fired and the trigger has not been jerked.
General values
The following values can be analyzed more closely:
- Difference in time between two shots
System Scatt is used: If the calculation is made with Scatt data, this means that the distance in time between the last measured value of the previous shot and the first measured value of the most recent shot is calculated.
System Scatt is not used: If the calculation is made without Scatt data, this means that the distance in time between the last shot and the most recent shot is calculated. - Highlight good and bad values
The top 20 % of the shots are marked in green, the bottom 20 % of the shots are marked in red.